
Comprehensive visual data solutions
Template Design
We use the chart specifications and sample slides provided by the client to create visually appealing PowerPoint presentation templates. Our design team supports the process by developing custom icons, backgrounds, themes, and other visual elements to enhance the overall presentation quality.
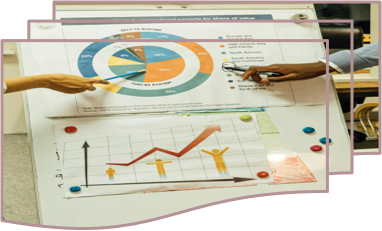
Manual Charting

Our manual charting specialists are highly skilled in handling both Qualitative and Quantitative presentations, with proficiency in advanced PowerPoint and Excel.
We work with processed data and client instructions to accurately update charts within PowerPoint and interactive Excel dashboards, supporting a wide range of projects including ad-hoc, multi-country, continuous and syndicated studies.
Automated Charting
We automate Excel-to-Excel and Excel-to-PowerPoint reporting using VBA Macros.
Our automation experts are well-equipped to handle all key functionalities typically required in quantitative market research presentations — including data updates, historical comparisons, significance testing, highlights, header/footer adjustments, sorting, image placement, and report-specific customizations. We work with processed data and client instructions to accurately update charts within PowerPoint and interactive Excel dashboards, supporting a wide range of projects including ad-hoc, multi-country, continuous and syndicated studies.
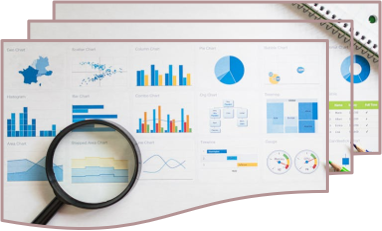
Report & Dashboard checking

We review client-built dashboards to ensure data accuracy, and alignment with business goals — helping you deliver trustworthy insights every time.
Our team meticulously reviews market research reports for data accuracy, logical flow, and presentation quality — helping research agencies and clients deliver flawless, insight-driven reports.
From data validation to layout checks, we help polish your market research reports (Both Power BI & PowerPoint formats) so they’re not just accurate — but impressive.